 Data capturing is vital for operating and troubleshooting SIP platforms. While capturing the SIP and RT(C)P traffic is essential, it is far from sufficient. The SIP platforms are far from being SIP engines only – there is a lot of non-SIP data, related to provisioning, to backends or integration (with other subsystem) or related to other layers in the system; data that is valuable when comes to capturing.
OpenSIPS 2.3 is the first to evolve to a non-SIP centric model (as tracing tool), in full alignment with Homer 6 (as capturing agent). This evolution introduces two new concepts (both on OpenSIPS and SIPCapture sides) when comes to capturing:
- non-SIP tracing – if up to this point, all the tracing was SIP-centric, now you can capture and visualize more types of data (MI commands, logs, network-level traces (TLS/WSS), REST queries)
- data correlation – now that you have so many types of traced data, it is vital to be able to correlate them, to see the relation/links between them (for example what REST queries were performed by a SIP call).
Non SIP tracing
Starting with the 2.3 version, OpenSIPS can natively trace more than the SIP data. This extension is totally correlated with the upcoming Homer 6 which is capable of displaying such non-SIP data.
Each data type has a custom format (as traced record) – this makes very easy the filtering and sorting of the records, by using some fields from the record.
So, what else can be traced now ?
Transport protocol layer
SIP relies on various transport protocols in order to be carried across IP networks. Events and additional data from the protocol layer may now be captured. OpenSIPS can report when a new connection was created or terminated, along with its properties (which varies a lot, depending on the nature of the connection – TCP, TLS, WS or WSS).
Besides having access to the properties of the connection (like the master key for TLS, the HTTP headers for WS), the protocol related traces may unveil errors/failures otherwise impossible to trace at SIP level. For example, an TLS connect attempt, even if rejected due invalid TLS certification, it will be traced and reported, even if there is no SIP at all in this case.
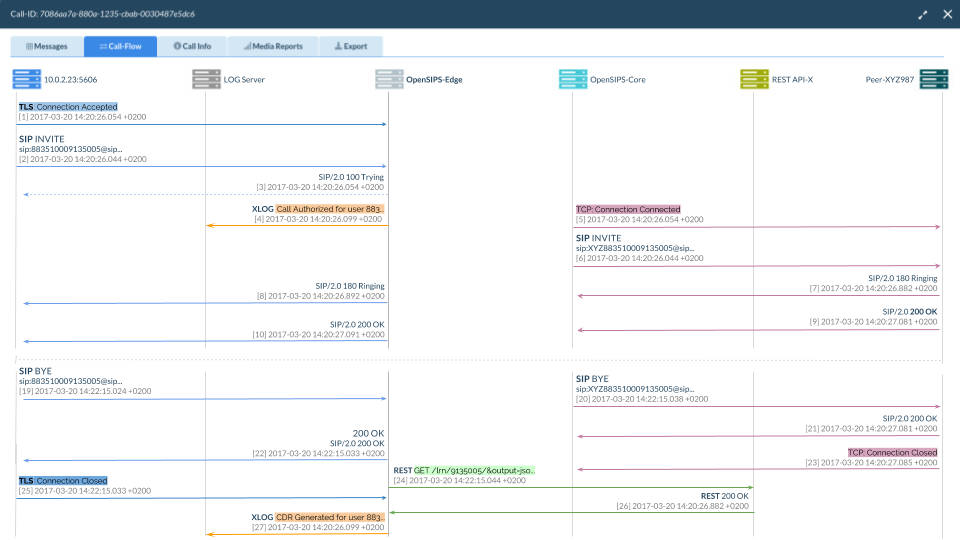 For each connection OpenSIPS reports its creation (with success or failure) and its termination (with its reason). Each connection can be correlated (linked) with the SIP sessions it carries. And vice-versa, having a SIP session, you can see all the connections that were used for it. Note that there is an N to M mapping here. See here some data on how the tracing records look like for the transport protocol in OpenSIPS 2.3.
Each transport protocol has the option to enable or disable the tracing of its connections. Even more, for flexibility reason, you can configure (per transport protocol) a script route to be triggered each time there is a new connection created – and testing the source IP/port, you can decide if you want to trace the connection or not.
loadmodule "proto_hep.so"
modparam("proto_hep", "hep_id",
    "[hid]CAPTURE_HOST:CAPTURE_PORT;transport=tcp;version=3;")

loadmodule "proto_tls.so"
modparam("proto_tls", "trace_destination", "hid")
modparam("proto_tls", "trace_filter_route", "trans_tracer")

route[trans_tracer] {
    /* trace only connections coming from IPs in group 20 */
    if (check_source_address("20"))
        exit;
    /* not tracing here */
    drop;
}
REST client queries
Similar, the REST queries performed from OpenSIPS script level (via the rest_client module) may be traced. This tracing is controlled via the siptrace module – when you decide to trace a SIP call, you can instruct to automatically trace the corresponding REST queries too:
sip_trace("tid", "d", "xlog|sip|rest");
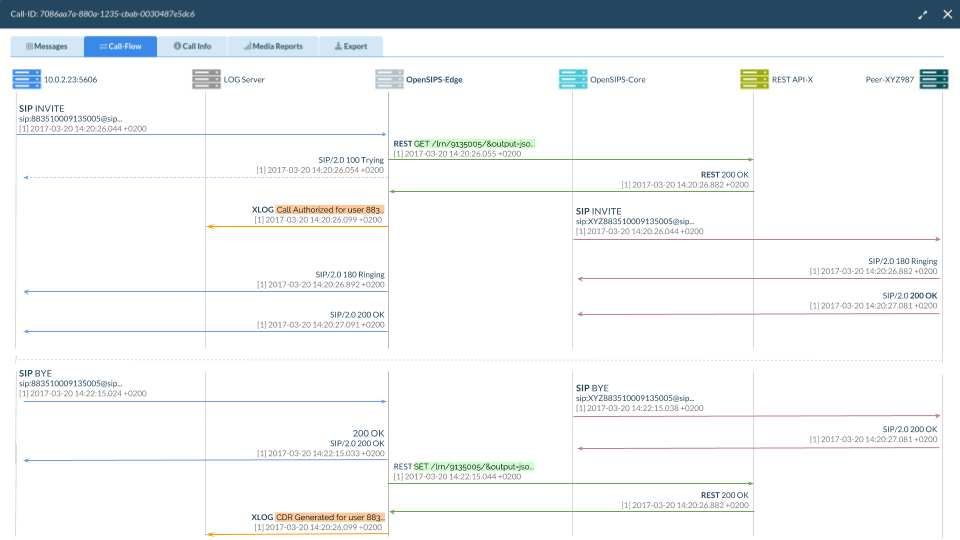 For each REST query, you will get 2 tracing records, one for the REST request and another one for its reply. The traces, using a correlation ID, are linked to the SIP session that triggered the queries. You can see here some samples for such tracing.
This tracing is very useful if you want to troubleshoot the REST queries, to see the URL and the used server, the sent attributes and returned data.
Script logs
Similar to the REST queries, OpenSIPS can directly trace the log messages you have in the OpenSIPS script. The tracing is done internally (no additional tool/service is needed) and it is controllable per SIP session, via the siptrace module – when you decide to trace a SIP call, you can instruct to automatically trace the corresponding logs too:
sip_trace("tid", "d", "xlog|sip|rest");
Each log message translates into one tracing records, stating the severity level and the text message – here are some samples for such records.
MI commands
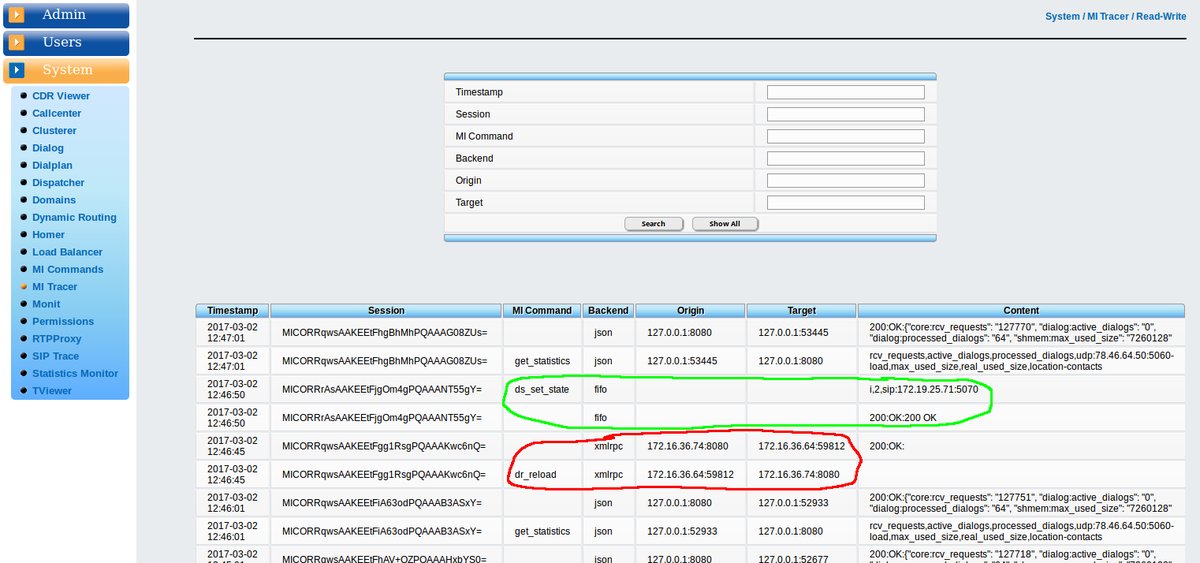 In terms on operational flow, the ability to trace the Management Interface (MI commands) is important. As this is part of the provisioning process (like reloading data, deactivating ACLs or destinations), usually a distributed provisioning (via web portals, integrated sub-systems, etc), it is important to know where from and who sent some MI commands were sent to OpenSIPS.
Each MI backend module has a parameter to enable the tracing and controlling what commands to be traced (using black or white lists).
loadmodule "mi_json.so"
modparam("mi_json", "trace_destination", "hid")
## all the other commands will not be traced
modparam("mi_json", "trace_bwlist", "w: dr_reload,ds_reload,lb_reload")
For each MI command, two tracing records are generated. One for the requests (showing its source, the backend, the command and its parameters) and one for reply (with status and limited output). You can see here some samples for such tracing.
Data Correlation
Now that we have multiple types of data, the ability to correlate them becomes important – to know what were the TCP/TLS/WSS connections involved in a SIP call, to know which were the REST queries or logs triggered by some call handling. The correlation concept gives a new dimension to tracing – you can navigate and jump between different data types in order to understand the relation between them (e.g. why a SIP call failed by looking at the data from the transport level).
Each capturing record has two types of correlation IDs:
- primary correlation ID – this ID correlates all the related records of the same type, like all the SIP packets of the same call or the request and reply of a REST query; of course, this can be only one per record.
- extra correlation ID – such an ID correlates the record to another data type. Like correlating a SIP packet to the network connection it uses, or correlating the REST records to the SIP call that triggered them; a record may have none or multiple extra correlation IDs.
See here the relation between the data types traced by OpenSIPS 2.3. when it comes to extra correlation:

Homer 6 will feature the ability to follow extra correlations and to give you the ability to navigate between the different data types.
Remarks
Moving away form the SIP-centric capturing and adding the ability to correlate different types of traced data opens new possibilities when comes to monitoring and troubleshooting large and complex SIP systems.
But you can find more on this at the official release of OpenSIPS 2.3 and Homer 6, during the OpenSIPS Summit 2017, in May, Amsterdam. We guarantee you will be amazed by what can be accomplished by two OSS teams working together !

Things are moving forward in OpenSIPS 2.4 (devel branch at this time) when comes to capturing – we just got the {isup.param} new transformation that allows you to access an ISUP body from various sources (rather than INVITE body).
How does this help you ?
As Jöran Vinzens from SIPGate presented during OpenSIPS Summit 2017 (see http://opensips.org/pub/events/2017-05-02_OpenSIPS-Summit_Amsterdam/Joran_Vinzens-OpenSIPS_Summit2017-ISUP_Debugging_with_Homer.pdf), you can capture ISUP from SS7 traffic and send it via HEP to a capturing node. And now, in the OpenSIPS capturing node you can parse and extract parameters from the ISUP body and save them (in human friendly text 🙂 ) into the tracing tables ….nice !
Thank you Vlad Patrascu for this cool transformation – http://www.opensips.org/html/docs/modules/2.4.x/sip_i.html#idp5572608
LikeLike