Whether you are a seasoned OpenSIPS administrator or you are still trying to figure out why your ACKs are looping all over your network, one thing is for certain: all of us will sooner or later need to have OpenSIPS produce some numbers which will answer questions such as:
- how many minutes has my OpenSIPS processed today?
- are we getting hit by a lot of scanner traffic?
- what amounts of bad SIP packets is provider X pushing into my platform?
- does my OpenSIPS instance have enough free memory during traffic peaks?
… and so on. Luckily for us, the statistics support in OpenSIPS enables script writers to solve all these problems quickly and intuitively. For a more objective description of the statistics support, you can go through the relevant wiki page.
In this article, we’re going to look at some more advanced uses of the statistics engine. But, first of all, what is this engine?
The Statistics Engine
By and large, this is what the entire statistics support looks like:

The statistics engine is built inside the OpenSIPS binary. It holds and manages all statistics, while exposing a standard CRUD operations interface for any OpenSIPS modules that intend to publish and/or manage their own sets of statistics.
Notice the three ways of interacting with the engine:
- directly from script (via the $script(my-stat) variable)
- via a web GUI or command-line HTTP clients (e.g. curl, wget, etc.)
- using a named pipe (a.k.a. FIFO), through the
opensipsctl tool
Ok, great! So the engine is very flexible and you can interact with it in lots of ways. But how exactly does this make our lives easier? Below are some of our tips on how you can fully exploit the statistics support in order to bolster each critical area of your OpenSIPS-based platform.
System Development/Operation
When doing OpenSIPS platform DevOps, you often need to keep track of several runtime parameters while working with the system. Depending on the area you’re dealing with, you may need to closely watch over SIP transactions, dialogs, memory usage, system load, etc.
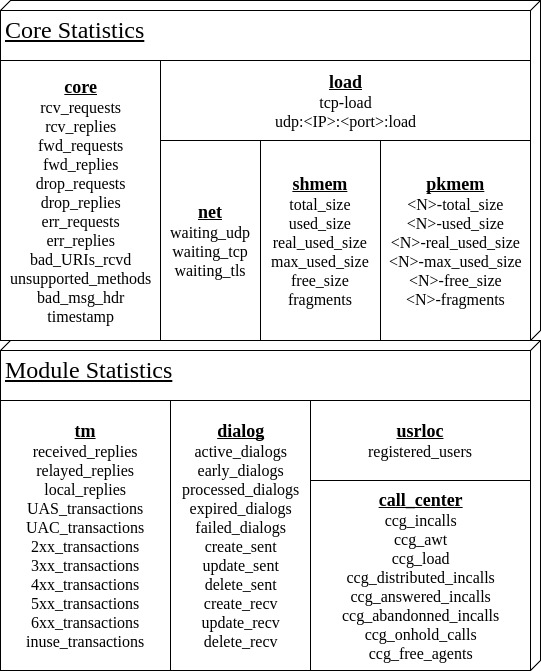
Below is a summary of the most often used OpenSIPS statistics groups, along with their corresponding statistics. For a detailed description of each stat, you can consult the wiki.

Glance Over Statistics
Say we’re pushing some sipp test traffic into the platform, and we want to closely watch over the current number of transactions, dialog module statistics and shared memory usage throughout the entire test. Or you just whitelisted a new SIP provider that’s going to start pushing traffic at 09:00 AM and you want to be on the lookout.
You could open up a new console and watch over the instance with:
watch -n0.2 'opensipsctl fifo get_statistics \
      inuse_transactions dialog: shmem:'
Notice that the get_statistics FIFO command parameters may either include the name of a stat (e.g. “inuse_transactions”) or the name of a stat group (e.g. “dialog:”). Group names must always end with a colon (“:”).
Interact With the “incremental” Statistics
Although they all look the same, statistics actually come in two flavors! First, we have the “incremental” ones. These statistics have a cumulative nature (e.g. “rcv_requests”, “processed_dialogs”, etc.) and immediately change upon some external stimuli (e.g. +2, -4, +1, etc.). Their opposite are the “non-incremental” statistics, which have a self-computational nature, and reflect the current state of some OpenSIPS subsystem at a given point in time. For example: “tcp_load”, “active_dialogs”, “real_used_size” (showing memory usage) – each of these is non-incremental since it is not a counter, but rather the result of some internal function.
All custom, script-defined statistics are incremental. OpenSIPS has no way of re-computing their value at any given point in time, so it will just treat them as counters and will leave the computing/management part to the script writer.
To quickly figure out the nature of a statistic (incremental or non-incremental), do:
opensipsctl fifo list_statistics
In some cases, it is desirable to periodically clear the “incremental” statistics. For example, you may want to reset your “processed_dialogs” or “daily_routed_minutes” daily, at 0:00 AM. To achieve this, you could set up a cron job that will do:
opensipsctl fifo reset_statistics processed_dialogs
Advanced OpenSIPS Scripting with Statistics
Apparently, OpenSIPS scripting with statistics is no more difficult than loading the statistics.so module and doing something like:
update_stat("daily_routed_minutes", "+1")
within your desired route in order to manage your custom statistics (counters). But requirements are often more complex and that is precisely what we’re going to look at!
Scripting With A LOT of Custom Statistics
Managing large amounts of custom statistics inside the OpenSIPS script was sometimes impossible and often lead to ugly code. Starting with OpenSIPS 2.3, you can write script code that is a lot more reusable thanks to statistic group and iteration support that we exposed to the script.
In this scenario, we want OpenSIPS to keep a daily tally of various parameters regarding the traffic that’s passing through it. Each day at, midnight, it would JSON encode all statistics and push them via HTTP POST to a platform’s web server. Note that the parameter requirements may change at any time, so we would also want to produce maintainable code.
In the first iteration, we decide to count each different SIP request, the total number of incoming SIP packets, along with the total amount of bytes processed by our OpenSIPS. We first define some meaningful, easy to extend groups for these statistics:
modparam("statistics", "stat_groups", "method, packet")
Next, we ensure our statistics get updated wherever is needed:
route {
    ...
    update_stat("method:$rm", "+1");
    update_stat("packet:count", "+1");
    update_stat("packet:total_size", "$ml") # message length
    ...
}

onreply_route {
    update_stat("packet:count", "+1");
    update_stat("packet:total_size", "$ml")
}
Finally, we write the daily update routine:
timer_route [daily_stat_push, 86400] {
    $json(all_stats) := "{\"method\": {}, \"packet\": {}}";

    # pack and clear all method-related statistics
    stat_iter_init("method", "iter");
    while (stat_iter_next("$var(key)", "$var(val)", "iter")) {
        $json(all_stats/method/$var(key)) = $var(val);
        reset_stat("$var(key)");
    }

    # pack and clear all packet-related statistics
    stat_iter_init("packet", "iter");
    while (stat_iter_next("$var(key)", "$var(val)", "iter")) {
        $json(all_stats/packet/$var(key)) = $var(val);
        reset_stat("$var(key)");
    }

    # push the data to our web server
    if (!rest_post("https://WEB_SERVER", "$json(all_stats)", , "$var(out_body)", , "$var(status)"))
        xlog("ERROR: during HTTP POST, $json(all_stats)\n");

    if ($var(status) != 200)
        xlog("ERROR: web server returned $var(status), $json(all_stats)\n");
}
Notice how we can add as many statistics as needed to our two groups, while not having to touch the timer route code at all. Neato!
Creative Ways of Using Statistics
What if I told you that you can use statistics with the dispatcher module in order to distribute calls based on actual load? It’s no more difficult than supplying the dispatcher with the following pattern:
modparam("dispatcher", "pvar_algo_pattern", "$stat(load_%u)")
After which we dispatch using algorithm #9, and increment the corresponding statistic for the newly selected destination:
ds_select_dst("DSG_PBX", "9"); # DSG_PBX is an m4 macro for "0"
update_stat("load_$du", "+1"); # new call for the selected server
Displaying OpenSIPS Statistics
As we discussed in the initial section, the OpenSIPS statistics engine offers plenty of ways for external applications to interact with it. Here is an outlook on what can be done:
OpenSIPS Control Panel
It is the quickest way to start viewing your OpenSIPS statistics. Install the Control Panel, visit http://localhost:8888/cp and click on System -> Statistics Monitor.

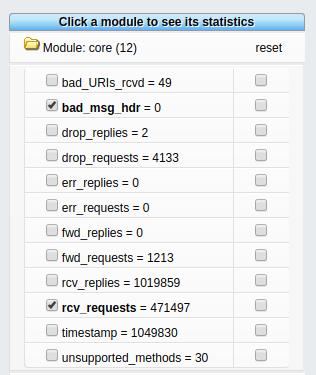
This is the first tab, “Realtime Statistics”. It fetches all OpenSIPS statistics any time you refresh the page, or hit the “Refresh Statistics Values” button. Notice the check marks to the left of each stat. Any checked statistic will have its values constantly recorded to the database, and view-able inside the “Statistics Charts” tab:

Custom Interfaces
If the Control Panel statistics display is not your cup of tea or if you’d like to have an all-in-one monitoring interface for your platform (e.g. using something like Grafana), you can make use of HTTP GET queries in order to fetch the statistics from OpenSIPS via JSON or XML encoded replies!
Here is an example of an HTTP GET for the “active_dialogs” OpenSIPS statistic:
$] wget -qO - http://localhost:8081/json/get_statistics?params=active_dialogs
{"dialog:active_dialogs": "0"}$]
Conclusions
The OpenSIPS statistics support offers a great way of both understanding the current health parameters of an OpenSIPS instance, as well as keeping track of various types of numerical data regarding the traffic that flows through it.
And as we add more monitored parameters to our VoIP services, it will be all the more easier for us to answer questions such as: “how well does it work?”, “how much more can I stress it?” and, most importantly, “is it still working?”.

