A key aspect of operating production systems is to be able to understand what your OpenSIPS is doing, why behaving in certain ways or what is the performance of it.
And of course, you want to do all those while your OpenSIPS is keep handling production traffic, so with no impact, no restart.
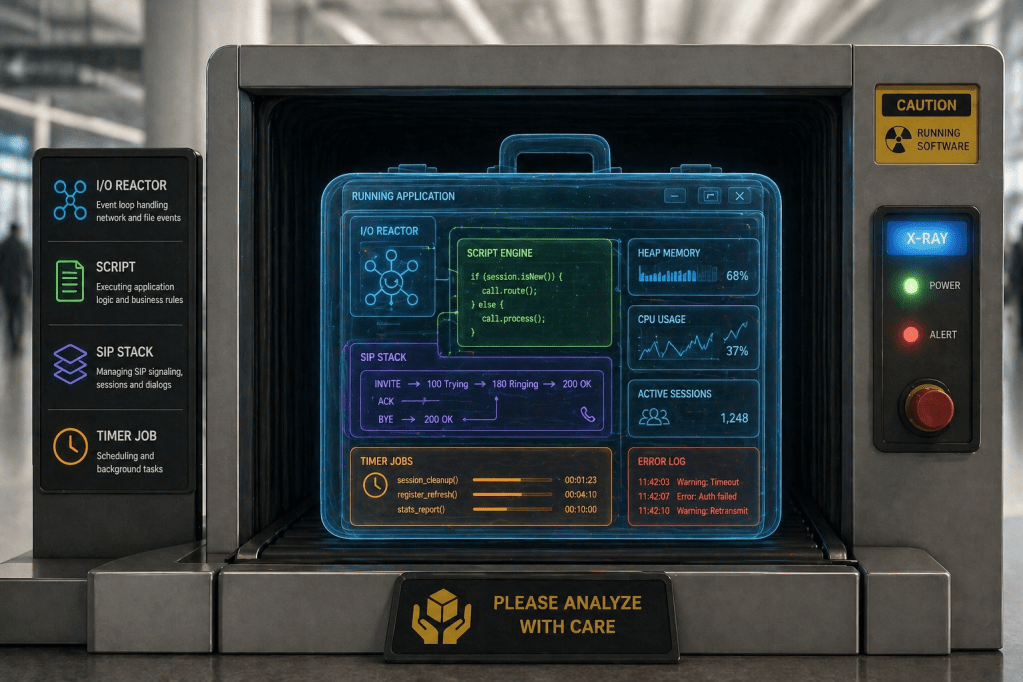
These are the reasons for OpenSIPS 4.0 to bring in the profiling support – or the real-time X-ray of OpenSIPS as application.
The profiling support answers to key needs like: what my OpenSIPS is doing, why is it slow or why not handling traffic.
Profiling overview
The profiling support is a build-in component of OpenSIPS 4.0 – no need to recompile or restart, just activate it whenever you need to understand what your OpenSIPS is doing.
The profiling support generates reports when certain tasks (usually time consuming) starts and end (as a sequence with all it sub-tasks):
Start session⎡Enter job⎸ ⎡Enter sub-job A⎸ ⎣Exit sub-job A⎸ ⎡Enter sub-job B⎸ ⎣Exit sub-job B⎣Exit jobEnd session
The profiling support comes with different means to access (from outside OpenSIPS) the profiling data in realtime, via different ways.
Profiling architecture
Architecturally speaking, the profiling support has two major types of components hooked into its internal API:
- profiling producers – entities generating the profiling records
- profiling consumers – entities responsible for providing the profiling records to the outer world, maybe different formats too.
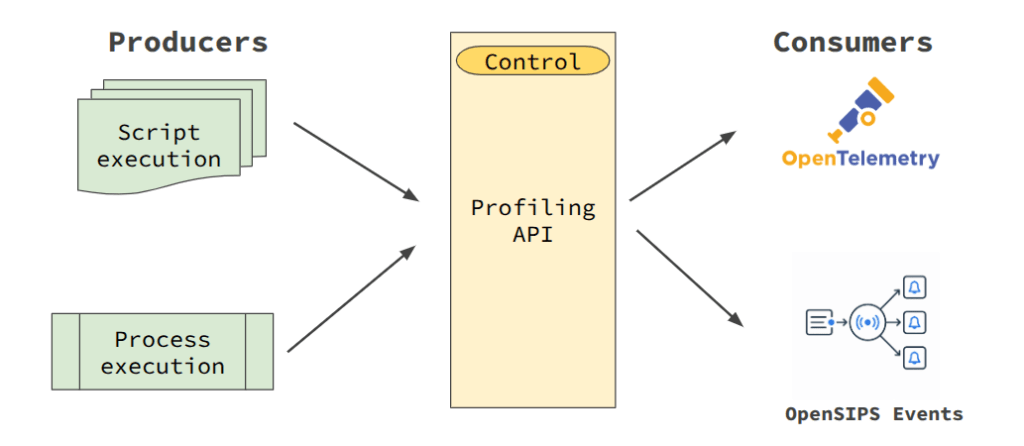
Profiling producers
There are currently two profiling sources in OpenSIPS 4.0, tackling the observability and profiling from two different levels: script and C code.
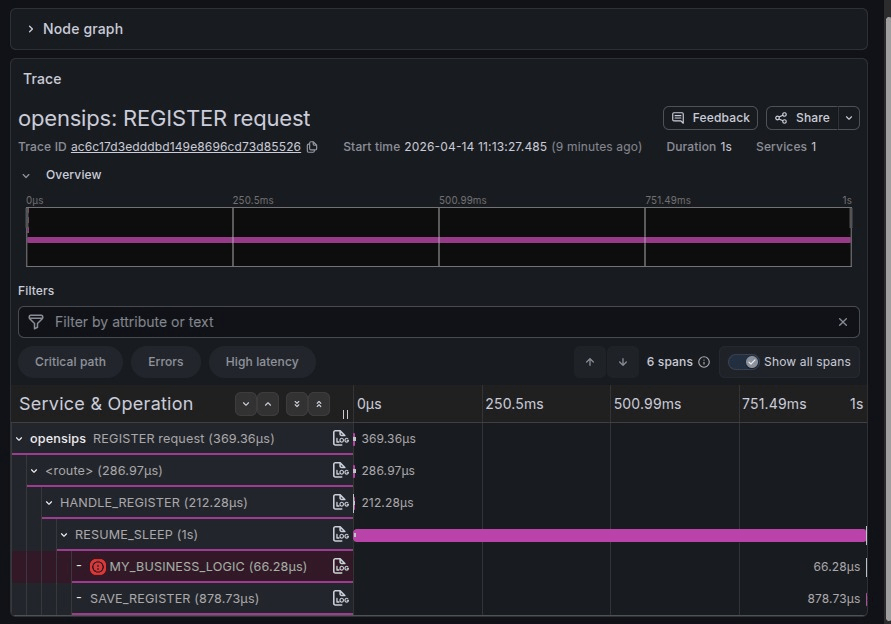
The script profiling is simple – the profiling records are generated each time a script route (or sub-route) is executed. So you can trace the actual execution path and the execution time. This is very useful if you are focus on understanding the performance of your OpenSIPS script.
The process profiling is performing execution tracing at C code level. Inside each process, the profiling starts from the I/O reactor level and goes all the way deep into SIP stack:
- Reading and processing SIP packages
- Resume of async or IPC jobs
- Timer jobs
- SIP related API calls (TM, Dialog, B2B)
- Extra processes (like mi_fifo, mi_datagram, httpd)
Profiling consumers
The OpenSIPS 4.0 currently provides two ways to access the profiling data – via the OpenTelemetry protocol (OTLP) and via OpenSIPS Events.
Using the OpenTelemetry module, you can get the profiling data sent to a OpenTelemetry server for being stored, analyzed and charted.
A easy, tool-free way to access the profiling data is via the OpenSIPS Events. OpenSIPS provides two events, the E_PROFILING_PROC & E_PROFILING_SCRIPT events. So you just need to subscribe via MI for such events. The event contains:
- sec: UNIX TIMESTAMP, seconds
- usec: micro seconds within the second
- session: session ID, to group all events part of a profiling session
- verb: profiling action as ‘start’,’enter’,’exit’ and ‘end’
- name: description of the profiling action
- type: the type of the process generating the profiling data
- depth: execution depth – ‘start’ is level 1, each ‘enter’ increases, each ‘exit’ decreases.
- file: cfg file name or C function where the profiling is done
- line: line in the ‘file’
- status: only for ‘exit’ and ‘end’, the status/retcode of the ‘name’ action (highly depends on its nature)
Here is an example (simplified) of the profiling records generated by the processing of SIP requests:
{'sec': 1776767469, 'usec': 195210, 'verb': 'start', 'name': 'SIP receiver udp:127.0.0.1:5060'}{'sec': 1776767469, 'usec': 195653, 'verb': 'enter', 'name': 'udp proto reading', 'file': 'handle_io', 'line': 317}{'sec': 1776767469, 'usec': 196071, 'verb': 'enter', 'name': 'receive_msg', 'file': 'receive_msg', 'line': 120}{'sec': 1776767469, 'usec': 196786, 'verb': 'enter', 'name': 'request_script', 'file': 'receive_msg', 'line': 235}{'sec': 1776767469, 'usec': 199569, 'verb': 'exit', 'name': 'request_script', 'file': 'receive_msg', 'line': 237, 'status': 1}{'sec': 1776767469, 'usec': 200219, 'verb': 'exit', 'name': 'receive_msg', 'file': 'receive_msg', 'line': 316, 'status': 0}{'sec': 1776767469, 'usec': 200757, 'verb': 'exit', 'name': 'reading done', 'file': 'handle_io', 'line': 324, 'status': 0}{'sec': 1776767469, 'usec': 201291, 'verb': 'end', 'name': 'SIP receiver udp:127.0.0.1:5060', 'status': 0}
You can see here a full sample, from multiple processes, doing a full call
Profiling control
In order to control the verbosity of the profiling process – especially when talking about the process level profiling where you may have timer jobs running 10 times per second -, OpenSIPS 4.0 provides an MI command for setting or checking the verbosity level of each process.
mi core:profiling_proc [id/pid=nn] level=2
The level may be as incremental levels:
- 0 – profiling is disabled
- 1 – SIP stack level (I/O reactor, SIP APIs)
- 2 – extra processes level
- 3 – timer jobs level
If the “level” parameter is missing, the function will perform a listing instead of a setting of the profiling level.
If no process is specified (by id or pid), the operation applies to all processes.
Next steps
In a follow post we will show how to interpret the profiling data – and put a diagnose – by using the OpenTelemetry or other helper tools
So, stay tuned for more
